Risk Back On

It’s really an interesting time to be an investor right now. With global risk, uncertainty and emotional warning signs around every corner, the world’s stock markets are thumbing their collective noses at it all. The US SP500 index has broken out to new highs and its price is above a rising 50 and 200-day moving averages, the sign of a healthy and strong uptrend. RSI momentum as also broken above its downtrend.  Using on-balanced-volume (OBV) as a secondary confirmation indicator (bottom pane), it hasn’t batted an eyelash as it too, has broken out to new, all-time highs.

san ramon fee only financial planning cfp fiduciary investment advisor spx 11-4-19.png

If you look across the globe, while few countries stock markets are at all-time highs, most have broken their downtrends and are positioning for a run higher. Whether this is anything more than just a reflexive, counter-trend bounce won’t be known until later but the message it is telling is very powerful to those who are listening, the risk trade is back on for global investors.

Stocks or Gold as the Better Investment?

Even going back millennia, it has been shown trends persist when it comes to investing. The reason why is because there is one thing that has been constant throughout, humans and human behavior. While the vehicles in which to invest changed as have the markets themselves, human behavior perseveres. One of the most recent examples has been investors 8-year preference of investing in US stocks over gold. During that period, US stocks (using the Dow Jones Industrial index as a proxy) have outperformed gold by > 275%. In hindsight, it made no sense to be “diversified” in gold as it was nothing more than an anchor to your portfolio. Stick with those that are in an uptrend and outperforming. The DJI/gold ratio chart below provides additional data that things just may be a changin’ with respect to under-performance of the shiny metal.

Ratio charts are a useful tool to help identify potential changes in longer term trends in addition to finding relative strength.. The sooner you can identify and confirm a change in direction, the sooner you are on board a rising, profitable trend and why every investor should have this arrow in their quiver.

san ramon fee only napfa cfp 10-30-19 goldtoindu.png

What makes the DJI/gold chart so interesting right now is that it peaked late last year and has since 1) broken its uptrend line and 2) formed 1-lower high and 2- lower lows. Both of these are required, at a minimum to confirm a trend change. If true (I would like to see the ratio create one more lower high before jumping on board), this is critically important as it potentially marks a huge change in where investors should commit their investment capital. Nothing moves in a straight line in either direction, but if true, be prepared for some gut checks along the way as the precious metals area are highly impacted by the FED’s decisions.

Supply and Demand

If there is any wonder why pot stocks dropped like a rock over the past year, the chart below helps to clear it up. The data contained within is really an amazing tell. As it turns out supply grew 100x and demand grew 2x. In case it’s not clear or a surprise, warehouses full of unsellable anything, including pot, leads to not only lower prices but stock prices too.

bay area napfa investment advisor cfp.png

Round Trip Ahead?

Just because my blog post on fake meat, BYND, in July turned out to be one day after the stock peaked, please do not blame me for its subsequent ~60% decline since.  I was only pointing out the obvious (or in this case ridiculous) and warning those that thought chasing that euphoric runup presented a good risk/reward opportunity. As it turned out it didn’t and that is how novice’s get burned. Emotion driven investing rarely ends well.

san ramon napfa cfp fiduciary investment advisor bynd 10-24-19.png

I like to take opportunities like this to make them teachable moments.  Avoiding big declines is the key to investment success over the long haul and this is a big decline. It’s important to note, I said BIG declines because declines are a normal part of investing, it’s just BIG declines that need to be avoided. In this case, BYND rose parabolically, created an oversold condition and saw sellers show up in big volume (institutional investors) at its top (a day before my post). As you can see it has since gone on to fill the open gap created on the way up, continues its decline with likely targets down at previous support levels, S1 & S2. There are no guarantees it will stop there so dip buyers, beware. This doesn’t look like its done falling. It’s possible this could return back to its IPO initial offering price or lower. If that were to occur, combined with the current oversold condition, it would be a place where I would be looking to return back to owning the stock and mark a complete round trip for fake meat.

It’s About Time

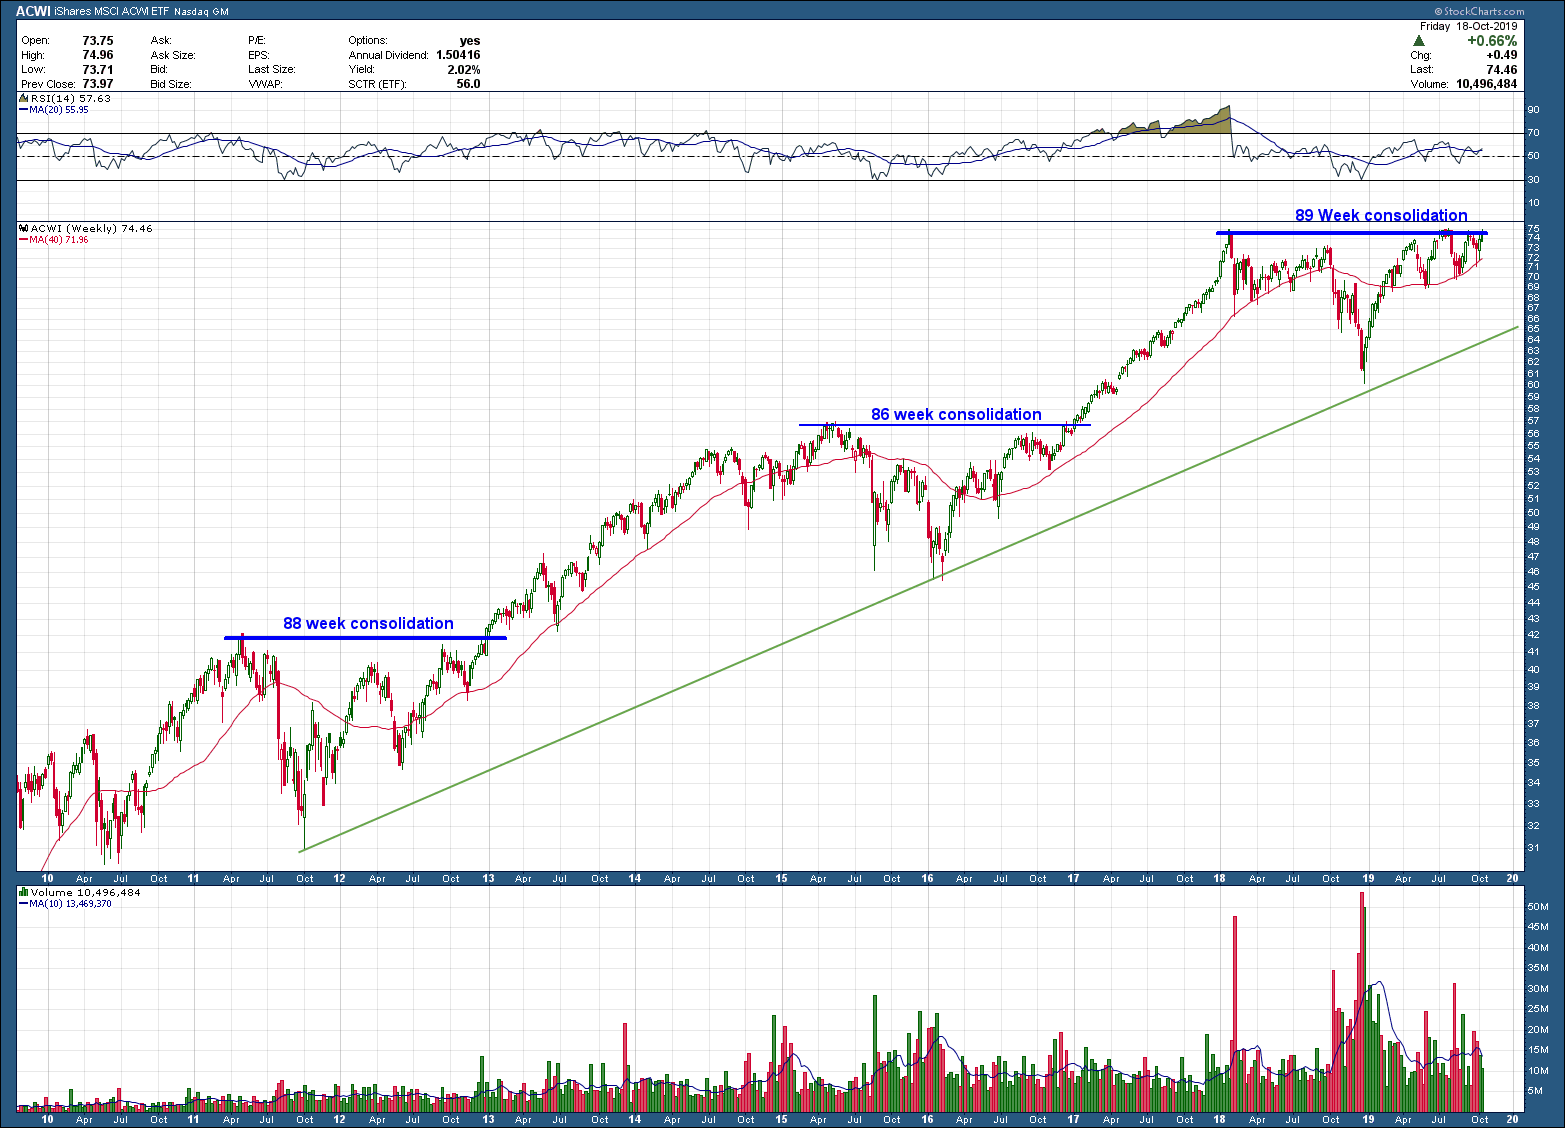
I like to follow the All-Country World Stock Index, ACWI, as it is a great way to measure global investor’s risk appetite around the world. If the index is rising, its a clear sign global investors are "all in" on stocks. As an investor living in the US, we have a tendency to focus our attention only on those investments in our own backyard and lose sight of the rest of the world. While that strategy has paid off over the past few years (mainly due to the rising dollar) it wont always be that way so its important to keep a close eye on what's happening across the globe. .

In the ACWI chart below, the index sits just a percent or two away from all time-highs, telling us its not just US stocks that are doing well. In addition, its price sits above its rising 200-day moving average, is sporting a bullish cup and handle bullish pattern (that is not yet confirmed) and in its 89th week of consolidation.  Notice how, since the 2009 bottom, the index has done the same thing twice before, consolidating 86 and 88 weeks before breaking out to its next leg higher, both exceeding runs of 30%.   

It's About Time.png

This is an excellent example of not only patterns repeating but symmetry too. If we believe this is not the end of this bull run, the next move would be for the index to breakout to new, all-time highs and from a timing standpoint, it would expect that should occur in the not too distant future.